Regional Data Libraries
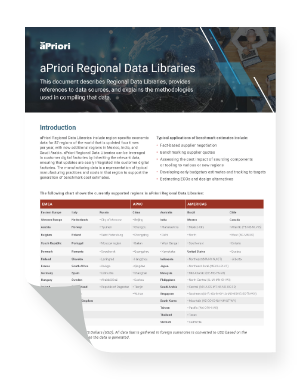
aPriori Regional Data Libraries include region specific economic data for 87 regions of the world that is updated semi-annually. aPriori Regional Data Libraries can be leveraged in customer digital factories by inheriting the relevant data, ensuring that quarterly updates are easily integrated.
The manufacturing data is a representation of typical manufacturing practices and costs in that region to support the generation of benchmark cost estimates.
View or download the datasheet here (no form required).